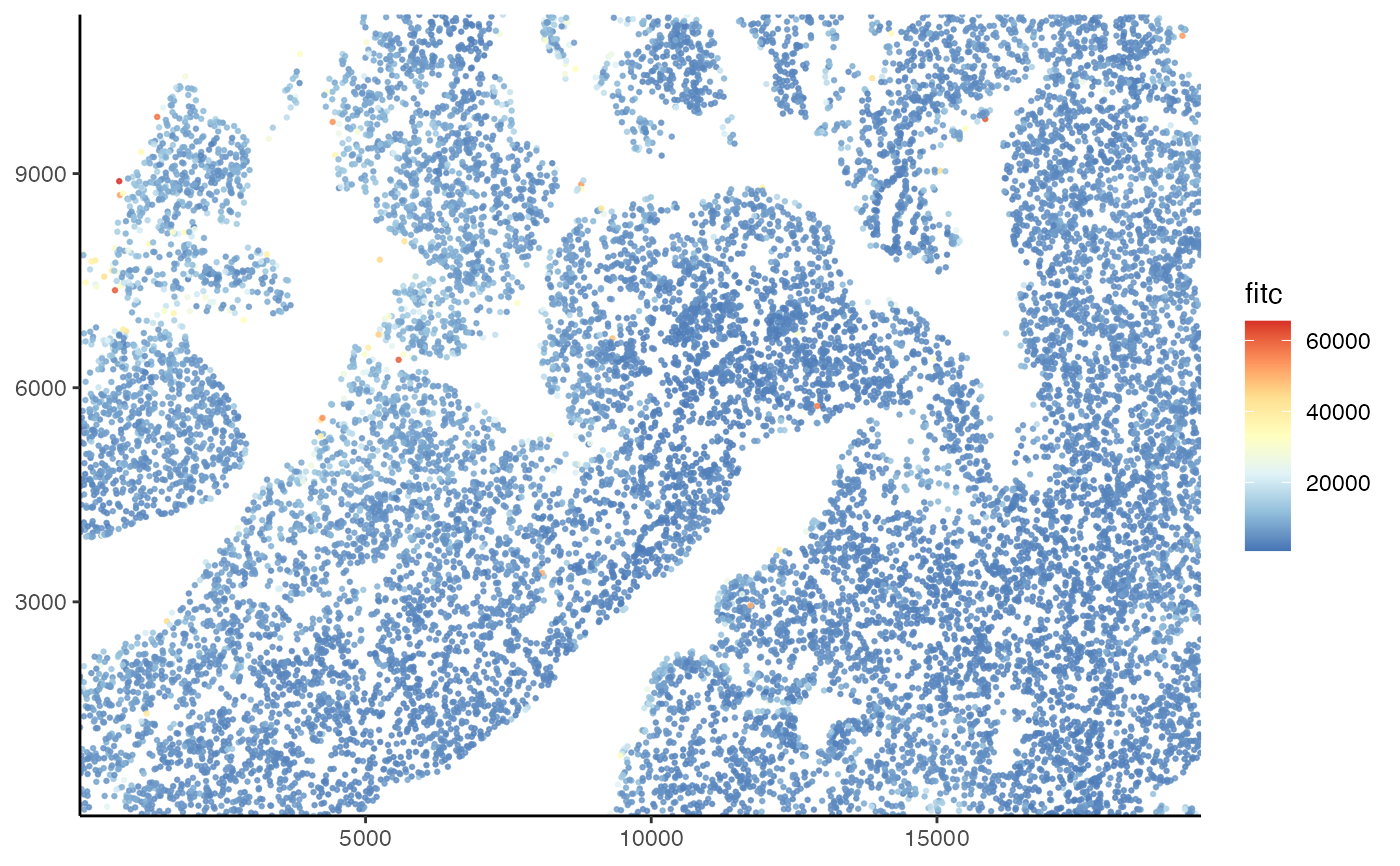
Plot the tissue slide showing the FITC intensity
plot_tissue.RdPlots the slide with each point representing a cell and the color represents the intensity of FITC.
plot_tissue(
  ts,
  color,
  prop = 0.25,
  point_size = 0.5,
  point_alpha = 0.8,
  color_pal = "RdYlBu"
)
Arguments
| ts | Tissue slide object to plot. |
|---|---|
| color | The column to use for coloring each cell. (enquoted) |
| prop | The proportion of cells to plot (too many cells can slow performance). |
| point_size | Size of each point. |
| point_alpha | Transparency of each point. |
| color_pal | A diverging color palette to be passed to
|
Value
A ggplot2 plot