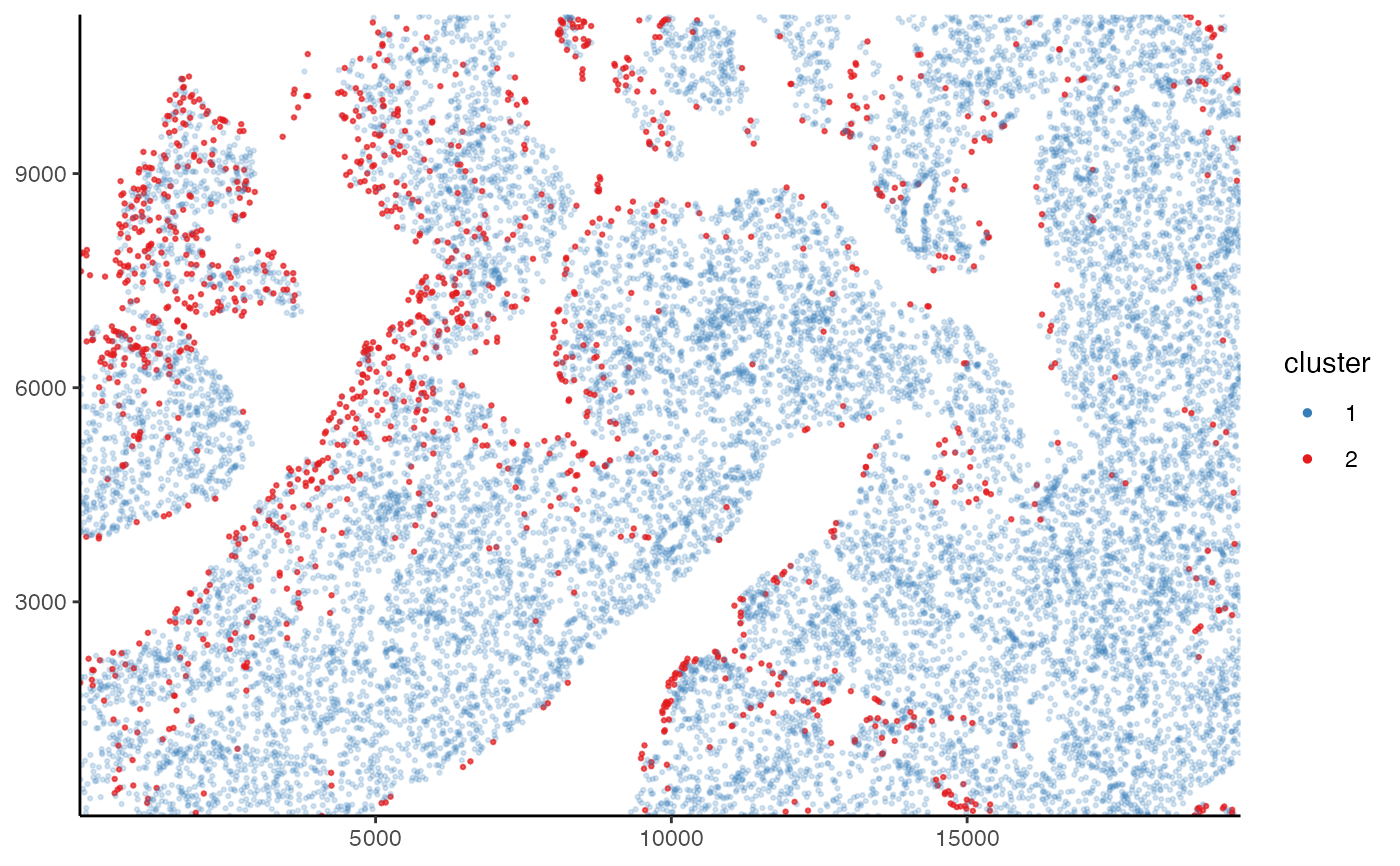
Plot the clusters on the slide
plot_slide_clusters.RdPlot the clusters on the slide
plot_slide_clusters(
  ts,
  method = "manual",
  prop = 0.25,
  point_size = 0.5,
  alpha_values = c(0.2, 0.7)
)
Arguments
| ts | A tissue slide object |
|---|---|
| method | The classification method to use. The classification should have already been done. |
| prop | The proportion of cells to include in the plot (too many cells can impact performance). |
| point_size | Size of each point. |
| alpha_values | A two-value vector where each value indicates the transparency of points coming from the two clusters. |
Value
A ggplot2 object.
Examples
pancreas_slide <- tissue_slide(pancreas)
pancreas_slide <- cluster_manually(pancreas_slide,
  fitc,
  cutoff = 4,
  transform = log10
)
plot_slide_clusters(pancreas_slide)